It can be practical to drill down into some of the motor industry stories that hit the news desks on a daily basis, states journalist Iain Robertson, who was amazed by a UK vehicle reliability item from US JD Power.
Many of the stories surrounding JD Power and its activities, while being highly relevant for the North American market, actually possess only limited appeal in the UK, mainly due to the Consumer Protection Act, which precludes direct research access by the company to British motorists. The first British survey results ever posted by JD Power Associates appeared in the BBC/Haymarket publication, ‘Top Gear’, around twenty years ago.
The company’s strength in its US domestic market is phenomenal. However, US citizens do not need to give permission to the McGraw-Hill Financial-owned business to carry out vehicle surveys. As a direct result, UK individuals responding to a survey request can often be described as ‘having an axe to grind’, which can stilt survey results quite significantly.
All the same, the recent 2016 UK Vehicle Dependability Study (VDS) has turned up some fascinating responses. Now in its second year, the study measures problems encountered by vehicle users in the past 12 months, of cars up to three years tenure. The total list equals 177 issues, across eight categories: engine and transmission; vehicle exterior; driving experience; features, controls and displays (FCD); audio, ICE, communications and sat-nav (ACEN); seating; heating, ventilation and cooling (HVAC); and vehicle interiors.
The overall dependability is scored on the basis of problems experienced per 100 vehicles (PP100), with the lower scores reflecting higher quality levels. Naturally, this is fascinating for a company like ISQA, which works closely and confidentially with its automotive and other sector clients. Therefore, it should be stated that the JD Power findings are neither accepted, nor denied by ISQA.
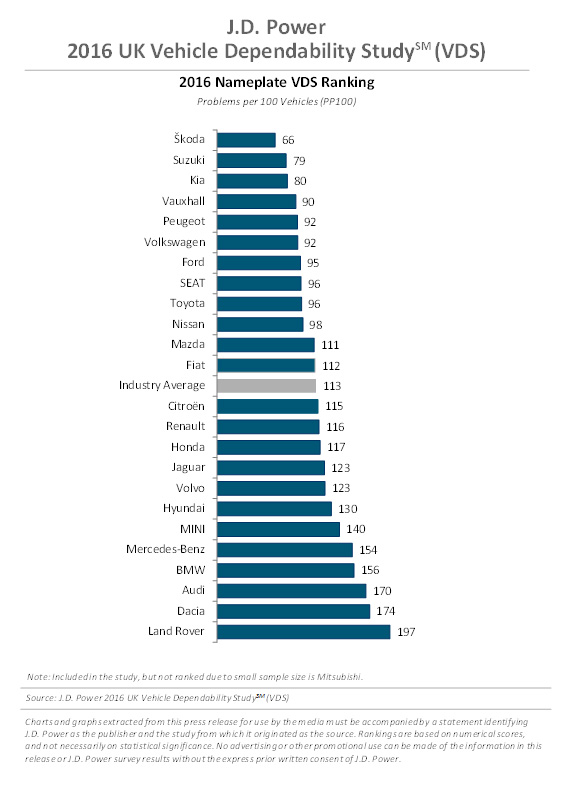
Interestingly, for the second year running, one brand has percolated to the top spot. It is a mainstream, high volume brand. The executive summary (below) highlights that with 99 PP100, it is the volume brands that lead the survey, whereas the premium brand average is 161 PP100, a difference of 62 PP100, reflecting a difference of 52 PP100 scored by volume brands in 2015.
It does appear that the additional technical and technological features applied to premium models are creating the largest source of quality issues, with five of the Top Ten problems being ACEN-related. In fact, respondents complained of difficulties with pairing mobile phones and connectivity issues, highlighting that built-in Bluetooth was the primary cause. The survey does have a valuable pay-off, in that it should direct premium carmakers to improving the customer experience, factoring in additional consumer support and providing technology training exercises on either side of the supplier:customer equation.
Dr Axel Sprenger, JD Power’s senior director of European automotive operations, stated: “Customers in the UK expect their vehicles to be problem-free, not merely for the first 90 days but also during the first three years of ownership. When owners experience even a single problem, this can be the initiation of losing confidence in the vehicle and the brand.”
JD Power has often concluded that expected dependability is one of the most important decision-making aspects, when buying a new car. Strong loyalty and advocacy of the model and brand often results. As the survey contemplates both breakages and design issues, their impact on the consumer can be equally substantial. Loyalty can be so easily upheld but, if lost, can take forever to win back.
Other general survey results highlight that both exterior (17.9 PP100) and engine/transmission (12.8 PP100), while still most problematic, have reduced in 2016. Of all the brands represented, Skoda came out top, as it did last year, with 66 PP100 and Suzuki was ranked second to it with a score of 79 PP100. Kia took third spot on 80 PP100, Vauxhall was next with 90 PP100 and Peugeot and Volkswagen shared fifth spot on 92 PP100. The industry average is 113 PP100 (114 in 2015).
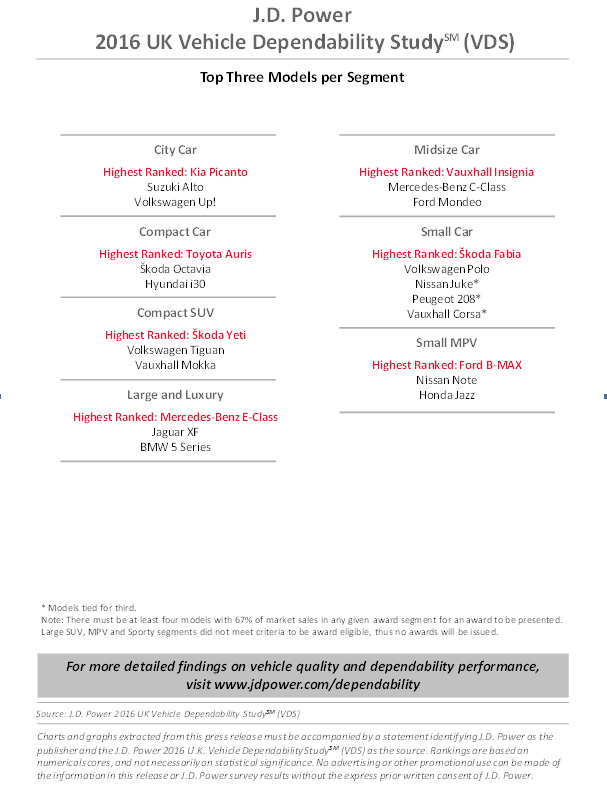
Skoda’s Yeti and Fabia models took category honours, while the Ford B-Max, Kia Picanto, Mercedes-Benz E-Class, Toyota Auris and Vauxhall Insignia also received segment awards. The study was held between February and April 2016, of 2013-2015 makes and models, and there were just over 13,000 participants. JD Power supplied the illustrations below.


